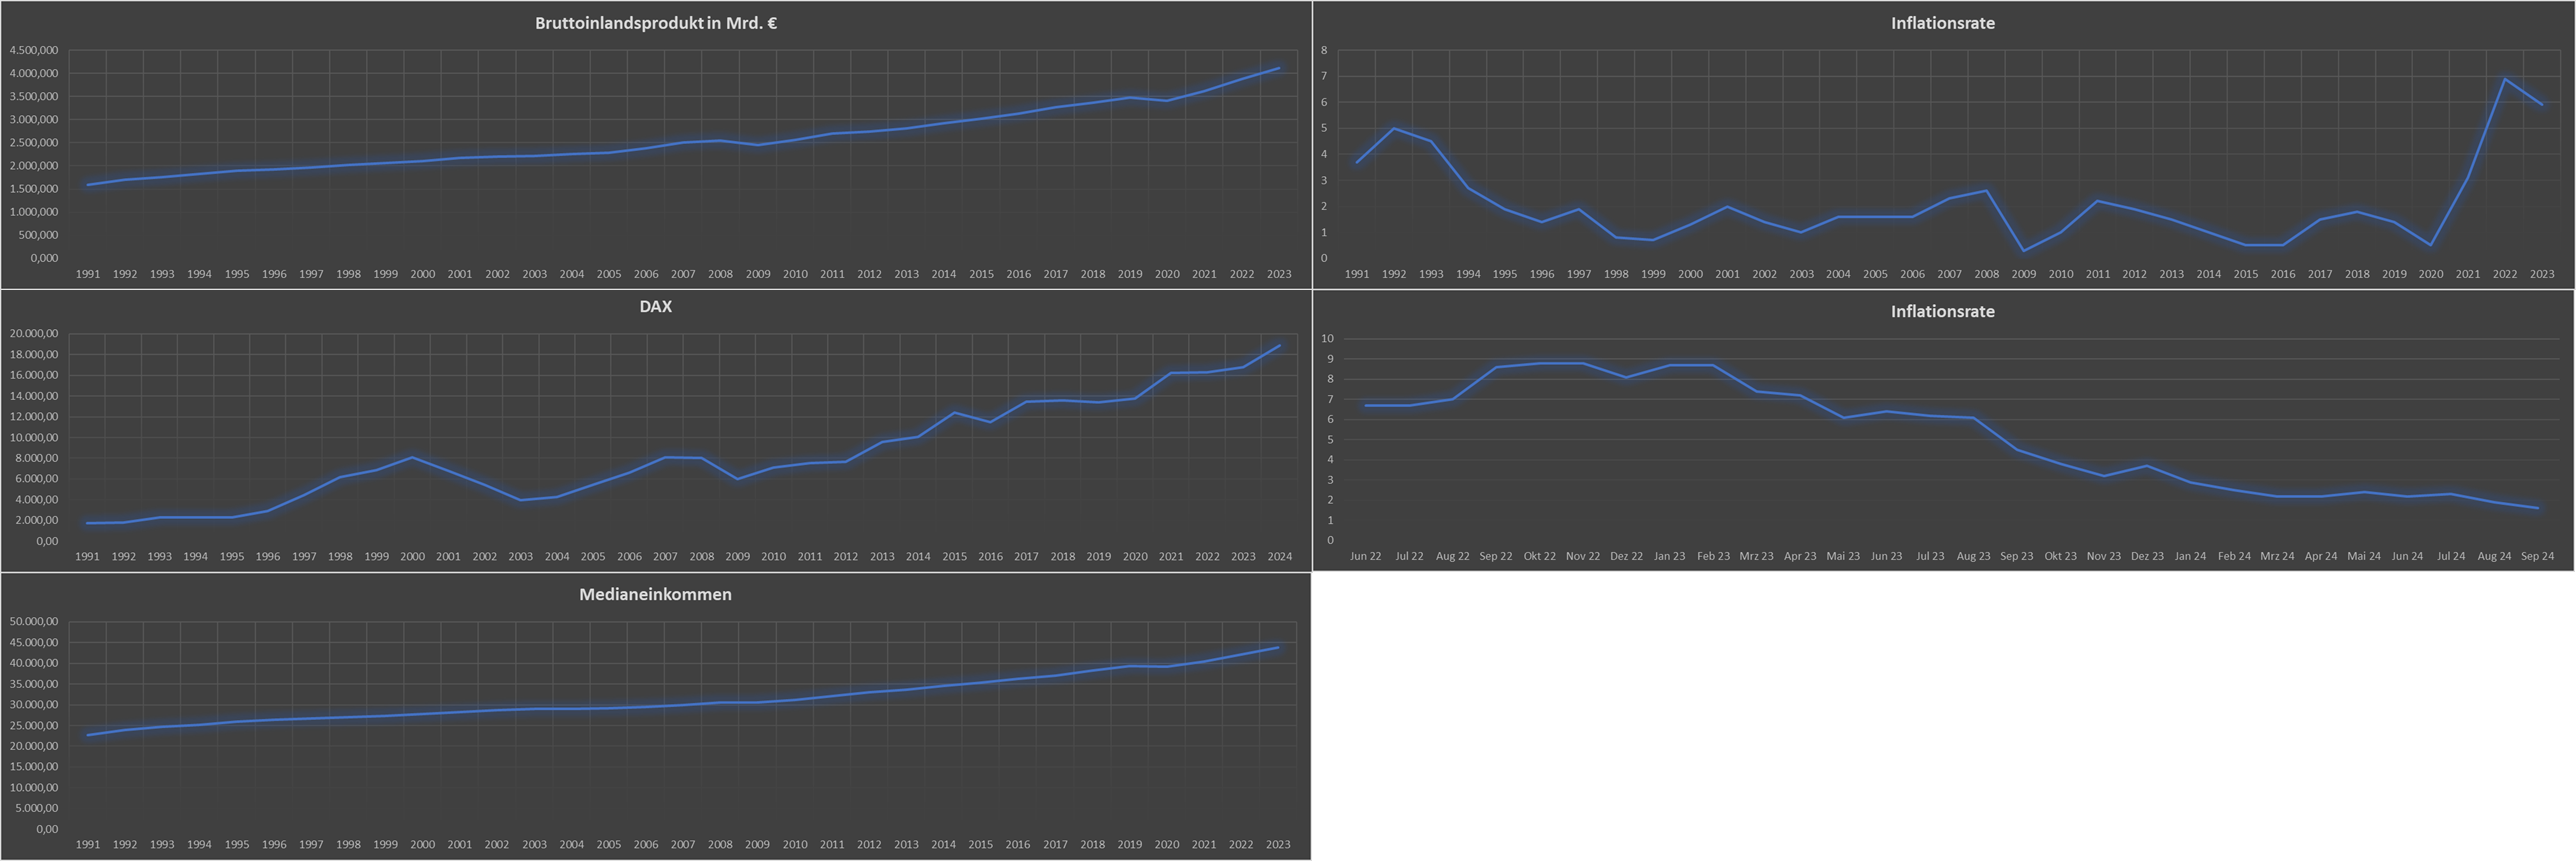
Hier findest du die Stabilität der Wirtschaft in Deutschland
BIP nach Quartalen: https://de.statista.com/statistik/daten/studie/3829/umfrage/entwicklung-des-bruttoinlandsprodukts-in-deutschland-nach-quartalen/
BIP Veränderungen in % nach Quartalen: https://de.statista.com/statistik/daten/studie/2284/umfrage/veraenderung-des-bruttoinlandsprodukts-der-deutschen-wirtschaft/
- Q1: https://www.absolventa.de/karriereguide/arbeitsentgelt/durchschnittsgehalt
- Q2: https://sozialversicherung-kompetent.de/rentenversicherung/zahlen-werte/1006-durchschnittsentgelt.html
- Q3: https://www.finanzen.net/index/dax/hochtief
- Q4: https://de.statista.com/statistik/daten/studie/1251/umfrage/entwicklung-des-bruttoinlandsprodukts-seit-dem-jahr-1991/
- Q5: https://de.statista.com/statistik/daten/studie/1045/umfrage/inflationsrate-in-deutschland-veraenderung-des-verbraucherpreisindexes-zum-vorjahresmonat/
- Q6: https://de.statista.com/statistik/daten/studie/4917/umfrage/inflationsrate-in-deutschland-seit-1948/
| Jahr | BIP(in Mrd. €) | DAX | Medianeinkommen | Inflationsrate |
| 1991 | 1.585,800 | 1.715,80 | 22.712,10 | 3,7 |
| 1992 | 1.702,060 | 1.811,57 | 23.938,69 | 5 |
| 1993 | 1.750,890 | 2.266,68 | 24.633,02 | 4,5 |
| 1994 | 1.829,550 | 2.271,11 | 25.125,91 | 2,7 |
| 1995 | 1.894,610 | 2.317,01 | 25.904,60 | 1,9 |
| 1996 | 1.921,380 | 2.909,91 | 26.422,54 | 1,4 |
| 1997 | 1.961,150 | 4.438,93 | 26.660,29 | 1,9 |
| 1998 | 2.014,480 | 6.171,43 | 27.060,12 | 0,8 |
| 1999 | 2.059,480 | 6.858,40 | 27.357,69 | 0,7 |
| 2000 | 2.109,090 | 8.069,98 | 27.740,65 | 1,3 |
| 2001 | 2.172,540 | 6.788,57 | 28.231,49 | 2 |
| 2002 | 2.198,120 | 5.453,95 | 28.626,00 | 1,4 |
| 2003 | 2.211,570 | 3.957,93 | 28.938,00 | 1 |
| 2004 | 2.262,520 | 4.270,56 | 29.060,00 | 1,6 |
| 2005 | 2.288,310 | 5.464,00 | 29.202,00 | 1,6 |
| 2006 | 2.385,080 | 6.617,85 | 29.494,00 | 1,6 |
| 2007 | 2.499,550 | 8.101,89 | 29.951,00 | 2,3 |
| 2008 | 2.546,490 | 8.045,97 | 30.625,00 | 2,6 |
| 2009 | 2.445,730 | 6.010,92 | 30.506,00 | 0,3 |
| 2010 | 2.564,400 | 7.077,99 | 31.144,00 | 1 |
| 2011 | 2.693,560 | 7.527,64 | 32.100,00 | 2,2 |
| 2012 | 2.745,310 | 7.672,10 | 33.002,00 | 1,9 |
| 2013 | 2.811,350 | 9.589,39 | 33.659,00 | 1,5 |
| 2014 | 2.927,430 | 10.087,12 | 34.514,00 | 1 |
| 2015 | 3.026,180 | 12.374,73 | 35.363,00 | 0,5 |
| 2016 | 3.134,740 | 11.481,06 | 36.187,00 | 0,5 |
| 2017 | 3.267,160 | 13.478,86 | 37.077,00 | 1,5 |
| 2018 | 3.365,450 | 13.559,60 | 38.212,00 | 1,8 |
| 2019 | 3.474,110 | 13.407,66 | 39.301,00 | 1,4 |
| 2020 | 3.403,730 | 13.790,29 | 39.167,00 | 0,5 |
| 2021 | 3.617,450 | 16.251,13 | 40.463,00 | 3,1 |
| 2022 | 3.876,810 | 16.271,75 | 42.053,00 | 6,9 |
| 2023 | 4.122,210 | 16.794,43 | 43.750,00 | 5,9 |
| 2024 | 18.869,36 | |||
| Jun 22 | 6,7 | |||
| Jul 22 | 6,7 | |||
| Aug 22 | 7 | |||
| Sep 22 | 8,6 | |||
| Okt 22 | 8,8 | |||
| Nov 22 | 8,8 | |||
| Dez 22 | 8,1 | |||
| Jan 23 | 8,7 | |||
| Feb 23 | 8,7 | |||
| Mrz 23 | 7,4 | |||
| Apr 23 | 7,2 | |||
| Mai 23 | 6,1 | |||
| Jun 23 | 6,4 | |||
| Jul 23 | 6,2 | |||
| Aug 23 | 6,1 | |||
| Sep 23 | 4,5 | |||
| Okt 23 | 3,8 | |||
| Nov 23 | 3,2 | |||
| Dez 23 | 3,7 | |||
| Jan 24 | 2,9 | |||
| Feb 24 | 2,5 | |||
| Mrz 24 | 2,2 | |||
| Apr 24 | 2,2 | |||
| Mai 24 | 2,4 | |||
| Jun 24 | 2,2 | |||
| Jul 24 | 2,3 | |||
| Aug 24 | 1,9 | |||
| Sep 24 | 1,6 |